1.
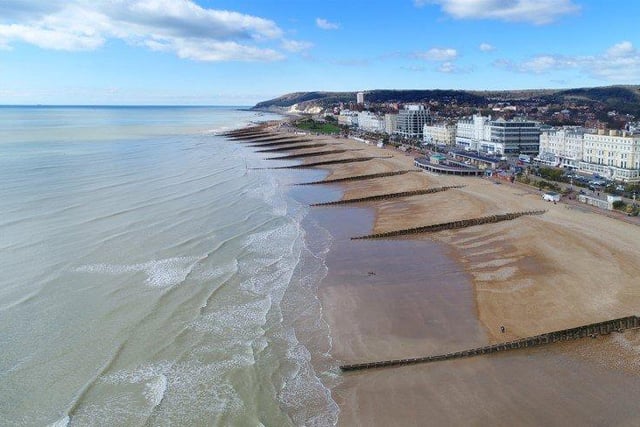
Eastbourne. SUS-211116-140728001
2.
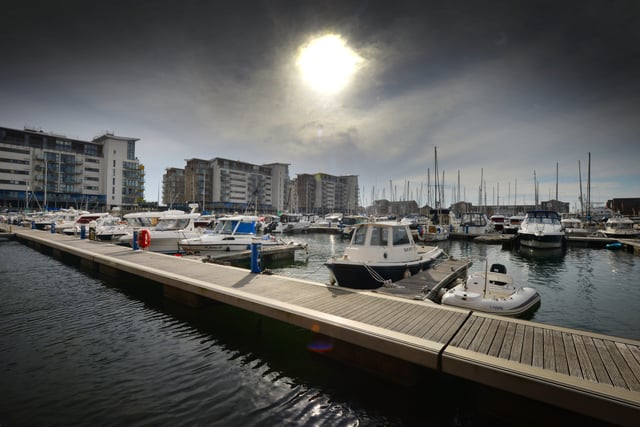
Sovereign Harbour - Rate of cases per 100,000, week to December 30: 1152.4 - Rate of cases per 100,000, week to January 6: 1301.5 - % change: 12.9% - Local authority rank by change in case rate: 10 - Rank by highest latest figures: 10

3.
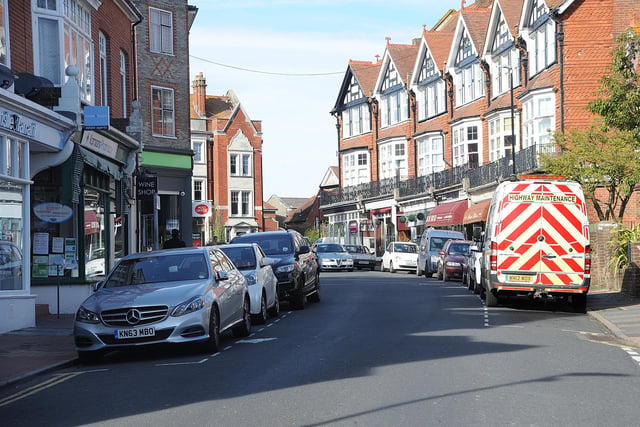
Upperton - Rate of cases per 100,000, week to December 30: 947.5 - Rate of cases per 100,000, week to January 6: 1234.6 - % change: 30.3% - Local authority rank by change in case rate: 7 - Rank by highest latest figures: 12
4.
Meads - Rate of cases per 100,000, week to December 30: 927.1 - Rate of cases per 100,000, week to January 6: 899.4 - - % change: 3.0% - Local authority rank by change in case rate: 12 - Rank by highest latest figures: 13
1 / 4